Financial
TITAN Group posted strong growth in turnover, EBITDA and net profit in 2015.
€1,397.8m
(+20.7%)
Turnover
Revenue received from the sale of goods and services to all customers
(2014: €1,158.4m)
€216.4m
(+19.2%)
EBITDA
Earnings before interest, tax, depreciation and amortization
(2014: €181.6m)
€33.8m
NPAT
Net profit after minority interests and taxes
(2014: €30.9m)
€173m
CAPEX
Expenditure on capital investment projects across the Group
(2014: €82m)
2.87
Net debt/EBITDA ratio
(2014: 2.98)
BB
Positive outlook
Credit rating by Standard & Poor’s
(2014: BB – Stable outlook)
Group net debt evolution (€m)
| Year | Net debt (€m) |
|---|---|
| 2009 Q1 | 1,112 |
| 2009 Q2 | 986 |
| 2009 Q3 | 988 |
| 2009 Q4 | 930 |
| 2010 Q1 | 947 |
| 2010 Q2 | 874 |
| 2010 Q3 | 831 |
| 2010 Q4 | 739 |
| 2011 Q1 | 739 |
| 2011 Q2 | 707 |
| 2011 Q3 | 732 |
| 2011 Q4 | 674 |
| 2012 Q1 | 754 |
| 2012 Q2 | 602 |
| 2012 Q3 | 632 |
| 2012 Q4 | 562 |
| 2013 Q1 | 596 |
| 2013 Q2 | 552 |
| 2013 Q3 | 563 |
| 2013 Q4 | 509 |
| 2014 Q1 | 541 |
| 2014 Q2 | 490 |
| 2014 Q3 | 529 |
| 2014 Q4 | 541 |
| 2015 Q1 | 660 |
| 2015 Q2 | 630 |
| 2015 Q3 | 650 |
| 2015 Q4 | 621 |
At the end of December 2015, Group net debt stood at €621 million and the net debt to EBITDA ratio stood at 2.87, a strong position in the context of the Group’s positive prospects for EBITDA growth in the years ahead. Group net debt is about half of what it was in the beginning of 2009.
View Group net debt evolution graph
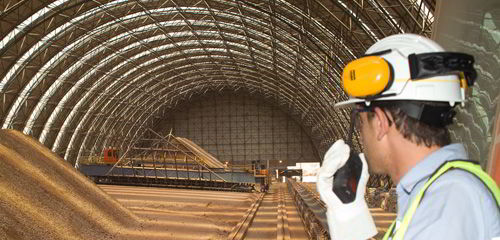
Non-financial: Social
In 2015, we responded to urgent matters such as the refugee crisis in Greece, and we further enhanced our collaborative initiatives as part of our strategy. We place a significant focus on social issues on which we can help make a difference, such as health and safety, employability and staff development. Below are some of last year’s highlights on our social performance.
TITAN Group LTIFR1
Employees and contractors (all activities)
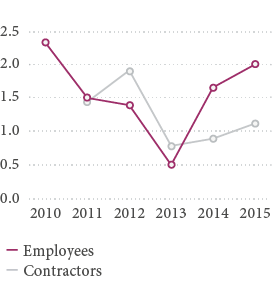
| Year | Employees | Contractors |
|---|---|---|
| 2010 | 2.33 | - |
| 2011 | 1.49 | 1.43 |
| 2012 | 1.38 | 1.91 |
| 2013 | 0.47 | 0.76 |
| 2014 | 1.65 | 0.87 |
| 2015 | 2.00 | 1.10 |
TITAN Group number of LTIs2
Employees and contractors (all activities)
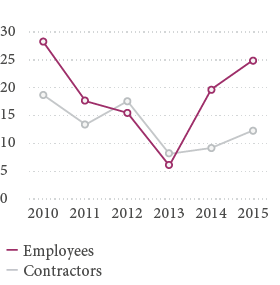
| Year | Employees | Contractors |
|---|---|---|
| 2010 | 26 | 17 |
| 2011 | 16 | 12 |
| 2012 | 14 | 16 |
| 2013 | 5 | 7 |
| 2014 | 18 | 8 |
| 2015 | 23 | 11 |
2015 Internships by country
| Country | Number of internships |
|---|---|
| Albania | 16 |
| Bulgaria | 0 |
| Egypt | 220 |
| F.Y.R. of Macedonia | 15 |
| Greece | 117 |
| Kosovo | 28 |
| Serbia | 11 |
| Turkey | 10 |
| USA | 15 |
| Total | 432 |
€2.4m
Donations
(2014: €2.2m)
110,776
Training man-hours
(2014: 130,067)
1. Lost-time injuries frequency rate.
2. Lost-time injuries.
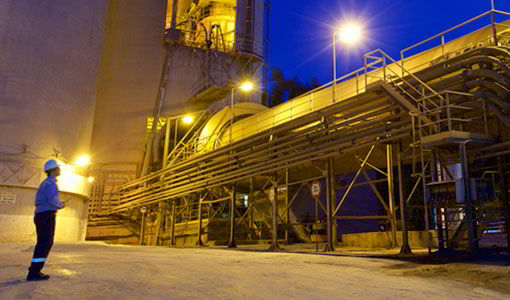
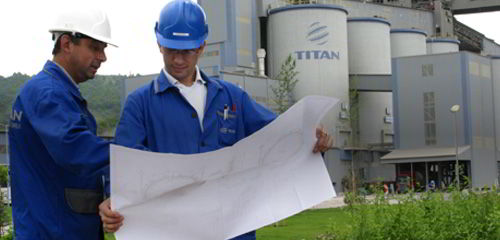
Non-financial: Environmental
Acknowledging our environmental responsibilities creates value for our business, our customers and the communities in which we operate. Here are some of the highlights of our progress in reducing our environmental footprint in 2015.
Environmental expenditure
(million euros)
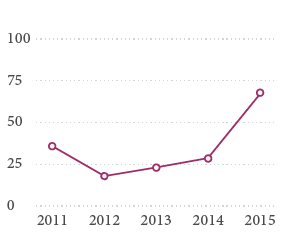
| Year | Million euros |
|---|---|
| 2011 | 36.6 |
| 2012 | 19.5 |
| 2013 | 24.6 |
| 2014 | 30.1 |
| 2015 | 67.8 |
Specific water consumption1
(lt/tCement)
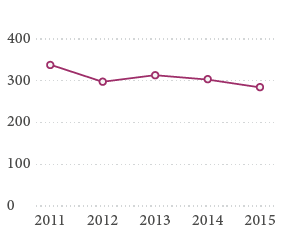
| Year | lt/tCement |
|---|---|
| 2011 | 340.1 |
| 2012 | 300.0 |
| 2013 | 315.5 |
| 2014 | 305.4 |
| 2015 | 287.1 |
711.4
kg/tProduct
Gross direct specific CO2 emissions2
(2014: 676.3 kg/tProduct, 2015 Group target: 628.0 kg/tProduct)
36.5
g/tClinker
Specific dust emissions2
(2014: 37.3 g/tClinker, 2015 Group target: 95.0 g/tClinker)
1,705.0
g/tClinker
Specific NOx emissions2
(2014: 1,612.1 g/tClinker, 2015 Group target: 1,670.0 g/tClinker)
211.2
g/tClinker
Specific SOx emissions2
(2014: 273.8g/tClinker, 2015 Group target: 240.0 g/tClinker)
1. Specific water consumption values are based on 2009 equity.
2. Specific CO2 and air emissions are based on 2009 equity.